The numbers behind the 2026 headlines
The 2025-26 admissions cycle closed on March 26, 2026, when all eight Ivy League schools released regular decision results on Ivy Day (the annual day when Ivy League regular decisions are released simultaneously). The headline numbers tell one story. The data behind them tells a richer one.
For the Class of 2030, every Ivy admitted under 9 percent of applicants. Columbia received 61,031 applications, its largest pool in history, and admitted 4.23 percent. Yale admitted 4.2 percent from 54,919 applicants. Brown's rate was 5.35 percent. Dartmouth's was 5.8 percent. The Common Application (the shared online platform used by over 1,000 US colleges) processed more than 8 million submissions this cycle, up from 7.1 million the year before.
Source: Yale News, "Yale admits 2,328 applicants to Class of 2030", March 26, 2026, news.yale.edu; Columbia Office of Undergraduate Admissions, Class of 2030 announcement, March 26, 2026, columbia.edu; Brown University, "Brown University admits 2,564 students to the undergraduate Class of 2030", March 26, 2026, brown.edu; Dartmouth News, Class of 2030 release, March 30, 2026, dartmouth.edu; Common App Deadline Update, March 12, 2026, commonapp.org
4.23%
Columbia Class of 2030 admit rate
4.2%
Yale Class of 2030 admit rate
5.35%
Brown Class of 2030 admit rate
5.8%
Dartmouth Class of 2030 admit rate
Half the Ivy League no longer publishes the full picture
What's different this year is not only the rates. For the second consecutive cycle, Harvard, Princeton, Penn, Dartmouth, and Cornell withheld detailed admissions data on Ivy Day. Harvard now releases its numbers only in October via its mandatory federal IPEDS filing (the Integrated Postsecondary Education Data System, the federal database all US colleges file admissions data into), several months after the new class has already enrolled. The official rationale cites the 2023 Supreme Court decision in Students for Fair Admissions v. Harvard, which ended race-conscious admissions, and an institutional preference for releasing data when the class is fully formed.
For families, this means the official numbers families have used for decades to benchmark a school's selectivity are increasingly unavailable in real time. Third-party trackers fill the gap, but with estimates instead of school-confirmed counts. Plan around the Class of 2029 figures, where data was last fully published.
For reference, the most recent published admit rates at HYPSM (Harvard, Yale, Princeton, Stanford, MIT) for the Class of 2029:
4.18%
Harvard Class of 2029 admit rate
4.59%
Yale Class of 2029 admit rate
4.42%
Princeton Class of 2029 admit rate
4.5%
MIT Class of 2029 admit rate
Stanford has not released annual admit rates since 2018 and continues to withhold.
Source: Harvard Office of Institutional Research and Analytics, October 2025, oira.harvard.edu; Yale News, March 27, 2025, news.yale.edu; Princeton University Office of Communications, April 2025, princeton.edu; The Tech (MIT student newspaper), March 20, 2025, thetech.com
The implication is not that admissions has gotten easier. It hasn't. The implication is that families now plan with less complete information than at any time since the modern Ivy League era began.
How an application actually gets read
Behind the headline acceptance rate sits a process that most families never see. Understanding it changes what a strong application looks like.
Five steps, one decision
When an application is submitted, it enters a pile of tens of thousands. The first step is geographic sorting. Each admissions officer (AO) is assigned a territory. They become the primary reader for every application from that territory. Columbia publishes a regional officer roster annually. According to Columbia's own job description for an Admissions Officer, each AO is responsible for evaluating approximately 1,100 to 1,200 applications per cycle, which includes reading the file, making admissions recommendations, and presenting the case to the admissions committee.
Source: Columbia University, Admissions Officer job posting, opportunities.columbia.edu, 2025
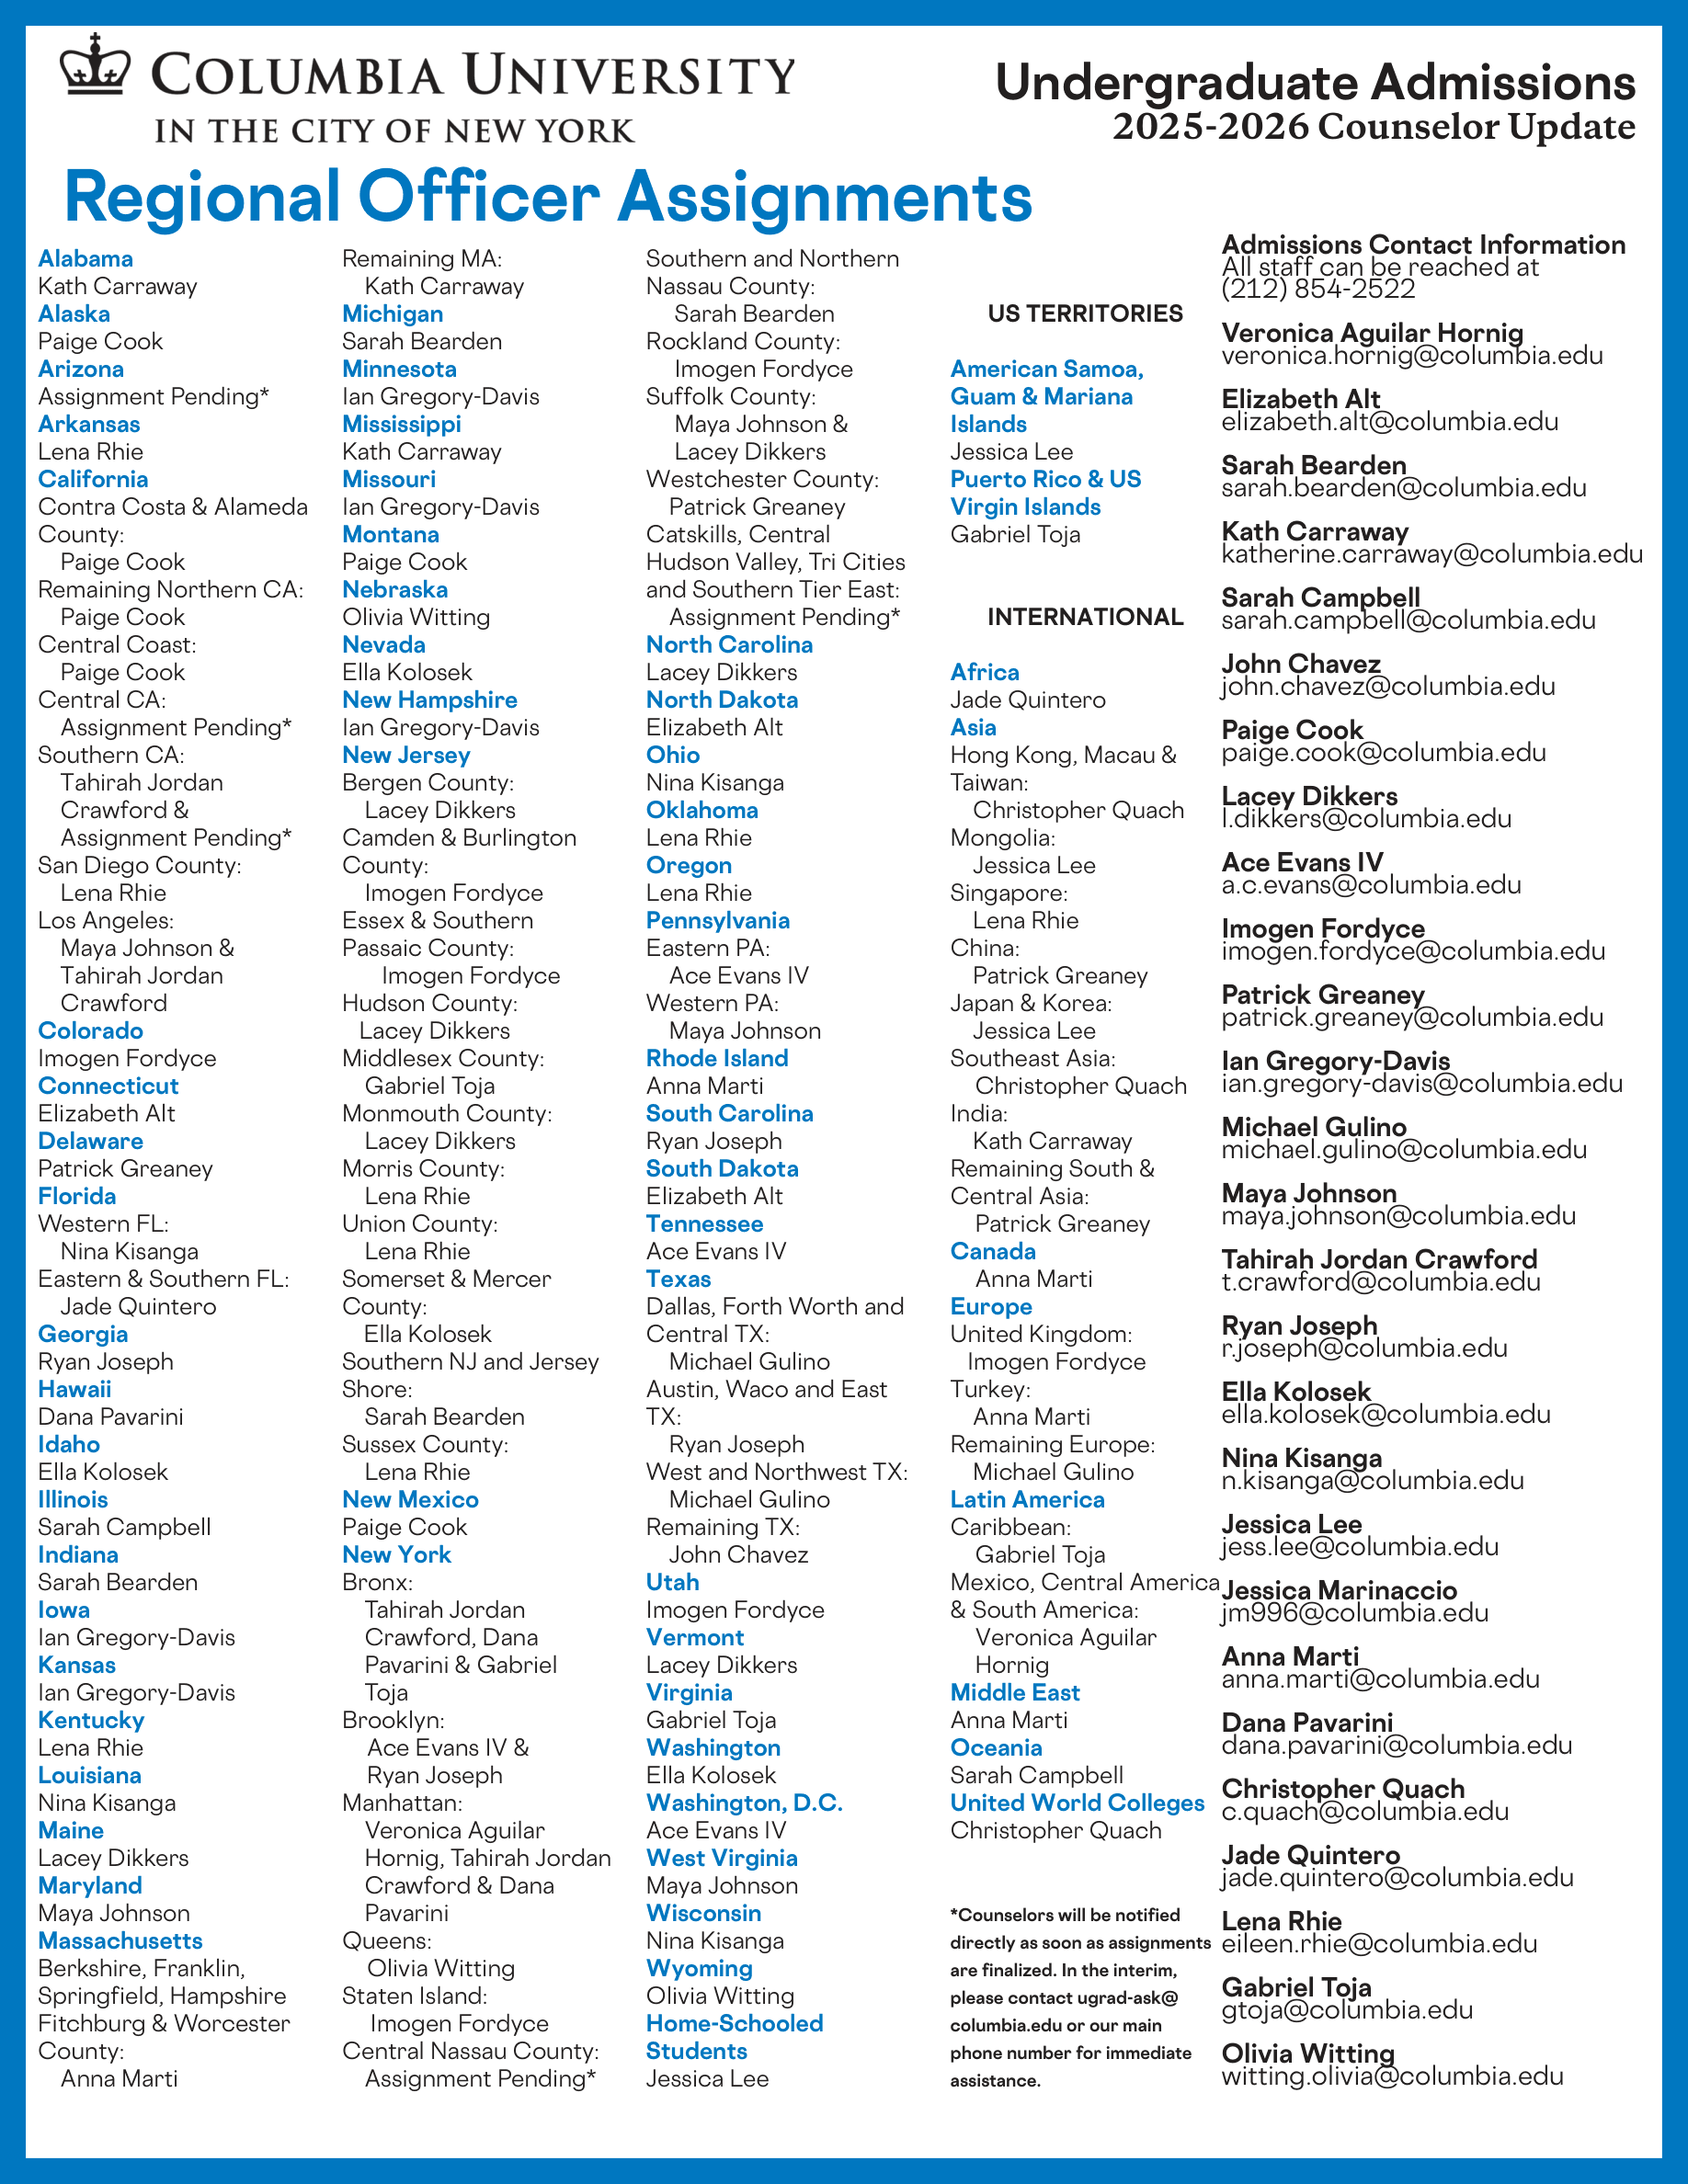
After the primary reader makes a recommendation, the file moves to committee review. In committee, the regional AO has to advocate for the student in a room full of skeptical colleagues. Students without a champion in that room do not make it through.
What this means for an application
First, your application is not a number. It is a 10 to 15 page document in a stack as tall as a person. The AO has seconds, not minutes, before deciding whether to keep reading carefully. Second, the only job of the application is to be unforgettable. Not impressive on paper. Unforgettable. The AO has to want to say the student's name out loud in a committee room. Third, this does not happen by accident. Every part of the application (grades, activities, essays, recommendations) needs to tell the same story, loudly and consistently.
Three structural trends, not noise
The numbers above are the visible part of three deeper shifts. Each has been building for a decade. Each has accelerated in the last five years.
Trend 1: Admit rates have compressed across the board
Columbia's admit rate in 2010 was roughly 11 percent. For the Class of 2030, it was 4.23 percent. This is not a one-cycle dip. It is a steady 15-year compression driven primarily by application volume rather than reductions in admitted class size. Class sizes at top schools have stayed roughly constant; what has grown is the pool of applicants chasing those seats.
On the Common App, applications per applicant rose from 4.63 in the 2013-14 cycle to 6.80 in the 2024-25 cycle. That is a 47 percent increase in 11 years. Each student now applies to nearly 7 schools on average, compared to fewer than 5 a decade ago. More students chasing fewer per-school seats, each of them sending more applications. Admit rates compress mathematically.
Source: Common App End-of-Season Report 2024-25, August 2025, commonapp.org
Trend 2: International applicants are leaving
Through March 1, 2026, international applications on the Common App were down 9 percent year over year. Applications from Asia fell 10 percent. From Africa 16 percent. From India 14 percent. China continued a multi-year decline, with total enrolled Chinese students at US universities now at 265,919, the lowest in eight years.
Source: IIE Open Doors 2025 Report on International Educational Exchange, November 17, 2025, opendoorsdata.org
Behind the application decline sits a sharper drop in actual visa issuance. New F-1 (the US student visa) issuance fell 35.6 percent from fiscal year 2024 to fiscal year 2025 according to the US Department of State. The F-1 refusal rate hit 41 percent in fiscal year 2024, up from 36 percent the year before, the highest in over a decade. F-1 visas issued to Indian students in the first half of 2025 dropped 43.5 percent. To Chinese students, 21.1 percent. Even students who are admitted increasingly cannot get to campus.
Source: US Department of State, Monthly Nonimmigrant Visa Issuance Statistics, 2025, travel.state.gov
The picture from individual countries is mixed. India still leads as the top source country (363,019 students in 2024-25, up 10 percent at the enrollment level) thanks to graduate programs and existing pipelines. But new enrollments overall dropped 7 percent. Many international families are diversifying. Chinese students enrolled in Malaysia grew from roughly 9,000 in 2019 to 47,000 in 2024. Canada, the UK, and Australia all gained share at the US's expense.
The international applicant story is not concentration at the top. It is contraction across the board, with the bottom contracting fastest. Survivors are visible at top schools mostly because everyone else has left.
Trend 3: The demographic cliff is starting
Common App total applicant growth slowed to about 2 percent year over year this cycle, down from higher rates in prior years. The largest single reason: US high school graduates peaked in 2025 and are projected to decline through the 2030s. Layered on top of the international decline above, the US college applicant pipeline is shrinking for the first time in a generation.
But this contraction will not make top schools easier to get into. Three reasons. First, top schools attract a disproportionate share of all applicants and that concentration is intensifying. Second, applications per student continue to rise. Third, many less-selective US schools are likely to close or merge through the 2030s. Families targeting the top end will compete against a smaller but more concentrated pool.
Your child's major matters more than the school
The headline admit rate of a university is, increasingly, almost meaningless. The number that matters is the admit rate for the major your child intends to study. The clearest single example sits inside UCLA.
UCLA: same university, 10 times the spread
UCLA's overall fall 2024 admit rate was 9 percent. Inside that 9 percent sit very different worlds. Nursing Prelicensure admitted 0.9 percent of its 5,790 applicants. Film and Television admitted 1.1 percent of 2,168. Computer Science admitted 4.1 percent of 10,529. Mechanical Engineering 3.8 percent. Meanwhile, in the College of Letters and Science, the Humanities Division admitted 9.5 percent of 11,811 applicants and the Physical Sciences Division 15 percent of 17,032. In the Herb Alpert School of Music, Music Performance admitted 31 percent.
Source: UCLA Undergraduate Admission, First-Year Profile by Major Fall 2024, admission.ucla.edu
| UCLA program (Fall 2024) | School / Division | Applicants | Admit rate |
|---|---|---|---|
| Nursing Prelicensure | School of Nursing | 5,790 | 🟥 0.9% |
| Film and Television | School of Theater, Film & TV | 2,168 | 🟥 1.1% |
| Mechanical Engineering | Samueli School of Engineering | 5,341 | 🟥 3.8% |
| Computer Science | Samueli School of Engineering | 10,529 | 🟥 4.1% |
| Humanities | College of Letters & Science | 11,811 | 🟨 9.5% |
| Social Sciences | College of Letters & Science | 36,322 | 🟨 9.3% |
| Life Sciences | College of Letters & Science | 31,945 | 🟨 11% |
| Physical Sciences | College of Letters & Science | 17,032 | 🟨 15% |
| Music Performance | Herb Alpert School of Music | 291 | 🟩 31% |
Icon legend: 🟥 admit rate under 5 percent (extremely selective). 🟨 admit rate 5 to 20 percent (moderately selective). 🟩 admit rate above 20 percent (relatively accessible).
Across mainstream majors with substantial applicant pools, the Nursing-to-Humanities Division comparison captures the picture cleanly: 0.9 percent versus 9.5 percent, a 10 times difference within the same admissions office, with 5,790 and 11,811 applicants respectively, both large pools. The headline 9 percent UCLA admit rate is the average. Your child's actual odds depend almost entirely on which door they walk through.
The pattern is national, not just UCLA
Computer science and engineering programs at the top schools now admit under 5 percent. Stanford CS, MIT, Caltech CS, CMU SCS all sit at single-digit admit rates well below the school average. Meanwhile, the humanities are contracting nationally. The share of US bachelor's degrees in the humanities fell from 13.1 percent in 2012 to 8.8 percent in 2022, a one-third decline. English degree completions dropped 33.1 percent between 2015 and 2024. Foreign language degrees dropped 37.4 percent.
Source: American Academy of Arts and Sciences, Humanities Indicators, 2024, amacad.org; College Transitions analysis of IPEDS, "Losing Ground: A Decade of Decline in Humanities Degrees", March 2026, collegetransitions.com
The career data is consistent with the admissions data. The US Bureau of Labor Statistics projects data scientist employment to grow 34 percent from 2024 to 2034 (median salary $112,590), compared to 3.1 percent for the overall economy. Computer and information technology occupations are projected to grow much faster than average. Healthcare overall is the fastest-growing sector at 8.4 percent. Software developers 17 percent. Information security analysts 29 percent.
Source: U.S. Bureau of Labor Statistics, Occupational Outlook Handbook 2024-2034 Projections, 2025, bls.gov
Choosing a major before choosing a school
Oak's Global Major Explorer covers the major fields offered at universities worldwide, including curriculum, career direction, and graduate outcomes for each field.
Early Decision and Early Action now decide most of the class
At many top schools, the class is largely filled before Regular Decision (RD) opens. This is the single biggest strategic change in the last decade.
What ED, EA, REA, and SCEA mean
Early Decision (ED) is binding: if the student is admitted, they must withdraw all other applications and enroll. Early Action (EA) is non-binding: students can apply early, get a decision in December, but still apply to other schools and decide by May. Restrictive Early Action (REA, used by Harvard) and Single Choice Early Action (SCEA, used by Yale and Princeton) are non-binding but require the student to apply to only one early-round program at a private US university. RD is the standard March round.
The fill rates at top schools
Brown filled 890 spots of its 2,564 total Class of 2030 admits (35 percent) through Early Decision. Yale admitted 779 of its 2,328 admits through SCEA, plus 118 via QuestBridge (a national nonprofit that helps low-income high-achieving students apply to selective universities), bringing early-round admits to 39 percent of the total. Columbia, Dartmouth, Penn, Duke, Northwestern, and Vanderbilt all reportedly fill roughly 45 to 50 percent of their class via early rounds. The exact fill percentages are increasingly hard to pin down because many schools have stopped publishing the breakdown.
35%
Brown ED fill rate of Class of 2030
39%
Yale early-round fill rate of Class of 2030
~45–50%
Estimated early-round fill rate at Columbia, Dartmouth, Penn, Duke, Northwestern, Vanderbilt
2–5×
ED admit rate vs RD admit rate ratio
The admit-rate gap between ED and RD
| School | ED/EA admit rate (most recent published) | RD admit rate (most recent published) |
|---|---|---|
| Brown (ED) | 16.5% (Class of 2030, Dec 2025) | 3.94% (Class of 2030, Mar 2026) |
| Yale (SCEA) | 10.9% (Class of 2030, Dec 2025) | ~3.5% (Class of 2030, est.) |
| Columbia (ED) | ~11–12% (Class of 2030, est.) | ~3% (Class of 2030, est.) |
| Dartmouth (ED) | ~18–21% (Class of 2030, est.) | ~4% (Class of 2030, est.) |
| Harvard (REA) | 8.74% (Class of 2028, Dec 2023) | 2.7% (Class of 2028, Mar 2024) |
| Vanderbilt (ED) | ~13% (Class of 2027, Dec 2022) | ~3.3% (Class of 2027, Mar 2023) |
Source: Harvard Magazine, "Harvard Admits 8.7 Percent of Undergraduate Early Applicants", December 15, 2023, harvardmagazine.com; The Harvard Crimson, "Harvard Accepts 8.74% of Early Applicants to Class of 2028", December 14, 2023, thecrimson.com; Harvard Magazine, "Harvard College Admits Class of 2028", March 2024, harvardmagazine.com
At nearly every selective school that publishes both rounds, ED applicants are admitted at 2 to 5 times the rate of RD applicants. This does not mean ED makes weak applicants into strong ones. The early pool is self-selected (stronger and more committed students apply early, often the same students who would have been admitted in RD). But the math of class composition is real: schools want to lock in enrollment from committed applicants. ED guarantees a 100 percent yield (yield is the percentage of admitted students who actually enroll). That has real value to admissions offices.
Yield management has made RD more unpredictable
For the Class of 2029, Columbia originally announced 2,557 admits, then activated 389 students off the waitlist as enrollment intentions came in. The overall admit rate moved from 4.28 percent to 4.94 percent. This kind of yield management has become routine. Students applying RD increasingly find themselves waitlisted or deferred not because they are unqualified, but because schools are managing enrollment numbers rather than evaluating applicants in isolation.
AI raised the floor, and the SAT came back
Two changes in the last three cycles have together reshaped what it means to be a qualified applicant.
AI made every application look better
When essay writing tools became widely available, a baseline of polish became universal. Grammar errors disappeared. Vocabulary expanded. Sentence structures became more sophisticated. The same effect operated on activity descriptions, supplements, and short answers. At the same time, grade inflation accelerated nationally. The combination produced a paradox: applications became individually stronger on paper while remaining harder to differentiate from each other.
What used to be impressive now reads as standard. The applicant whose essay is technically polished and whose grades are nearly perfect is no longer distinctive. AI raised the floor for every applicant, and the floor is now where the average sits.
The SAT and ACT came back as the differentiator
Through the pandemic-era test-optional period, most selective US colleges suspended SAT and ACT requirements. That era is functionally over at the top. For fall 2026 admission (the Class of 2030 cycle), the Ivy League testing landscape is:
| School | Test policy for fall 2026 admission |
|---|---|
| Harvard | SAT or ACT required |
| Yale | Test-flexible (SAT, ACT, AP, or IB) |
| Princeton | Test-optional (last cycle; required from 2027) |
| Columbia | Permanent test-optional (only Ivy) |
| Penn | SAT or ACT required |
| Brown | SAT or ACT required |
| Dartmouth | SAT or ACT required |
| Cornell | SAT or ACT required |
Source: Each school's undergraduate admissions office; Penn announcement February 2025; Cornell announcement 2025
On the Common App, the number of applicants reporting a test score grew 11 percent year over year in the 2025-26 cycle, while non-reporters dropped 5 percent. Score reporters now outnumber non-reporters at most application deadlines for the first time since the pandemic. The implication is clear: at the top of the system, you need the score.
The Supreme Court ruling shifted admit composition
On June 29, 2023, the US Supreme Court (often abbreviated SCOTUS) ruled in Students for Fair Admissions v. Harvard that race-conscious admissions violates the Equal Protection Clause. The 2025-26 cycle is the second full cycle operating under the new rules. Harvard's Class of 2029 admit data, released in October 2025, showed Asian students reached a record 41 percent of the admitted class (up from 37 percent the year before). Black admits fell from 14 percent to 11.5 percent. Hispanic admits fell from 16 percent to 11 percent.
Source: Harvard Office of Institutional Research and Analytics, Class of 2029 admissions data, October 2025, oira.harvard.edu
For Asian-background applicants specifically, this shift is consequential. The number of qualified Asian applicants applying to top schools has been growing for years. The Supreme Court ruling removed one mechanism that constrained their share of admits. The early data suggests the share is indeed rising, though final outcomes depend on each school's response.
What works now
If the structural shifts above describe how admissions has changed, the practical question for families is what to do about it. The new playbook has two parts: how the application itself is built, and when the work starts.
What stopped working
Activity stacking (long lists of clubs, competitions, and programs without meaningful depth in any one). Polished, perfect-sounding profiles that read as generic. Achievements listed without context for what they actually required. Long explanations across every section. Looking impressive on paper but indistinct in person. These features used to differentiate a strong application from a weak one. They no longer do.
What works now
Depth over breadth. One or two areas of genuine, demonstrated commitment over five years rather than fifteen activities over four. A distinct voice in essays that is specific, human, and difficult to replicate with AI. Personal narrative: reflection on what an experience meant and how it changed the student's thinking, not just what they accomplished. Intentional brevity: shorter sections force every word to count. Being unforgettable in a committee room full of strong applicants.
When the work starts
Top applicants are not built senior year. They arrive at the application with years of documented commitment behind them. The timeline that matches what gets admitted to top US universities looks roughly like this:
Grade 9 and 10: interests identified, early activities underway, academic trajectory established. Grade 11: commitments deepen, leadership emerges, research projects or competitions take shape. Grade 12: the application captures what already exists.
The application is a transcript of years of work, not a sprint at the end. Families who treat senior year as the beginning of college planning are already behind families who treat freshman year that way.
Mapping the path early
Oak's free assessment helps families understand where their child sits today and what concrete next steps make sense given their interests, current trajectory, and target schools.
Frequently Asked Questions
Does Early Decision actually improve my child's chances, or are stronger students just applying ED?
Both are true at the same time. The early pool is genuinely self-selected: students who apply ED are typically stronger, more committed, and would have been admitted in many cases anyway. But the math also matters. Schools fill 35 to 50 percent of the class in early rounds, leaving fewer Regular Decision seats for a much larger RD applicant pool. For a student who has a clear first choice and an academic profile competitive for that school, applying ED is generally the strategic choice. For students still deciding or aiming above their realistic range, ED is a worse bet.
Can my child still apply without an SAT or ACT score?
For the Class of 2030 cycle, only Columbia among the Ivies is permanently test-optional. Princeton is test-optional for one more cycle. Yale accepts SAT, ACT, AP, or IB scores under its test-flexible policy. The other five Ivies require SAT or ACT. Beyond the Ivies, most peer institutions (MIT, Caltech, Duke, Stanford, Brown, Dartmouth) have also reinstated testing. Common App data shows the share of applicants reporting test scores grew 11 percent this cycle. At the top of the system, you should plan to submit a score.
Is it still worth applying to US universities as an international student?
It depends on your country, your field, and your financial situation. The data shows a sharper drop in F-1 student visa issuance than in applications: 35.6 percent fewer new F-1 visas issued in fiscal year 2025 versus 2024, with refusal rates at 41 percent. Indian and Chinese students face particularly steep visa declines. Many families are diversifying to Canada, the UK, Australia, Singapore, or Hong Kong. The US remains the largest single destination for international students by total enrollment (1.18 million in 2024-25), but the friction of getting there is increasing. Families should plan with backup destinations rather than betting everything on the US.
At what grade should we start preparing for US college applications?
The students who get into top schools typically arrive with documented activities, leadership, and academic trajectory established by the end of grade 10. That means meaningful exploration should start in grade 8 or 9. This does not mean putting young children through high-pressure programs. It means giving them exposure across academic and extracurricular fields so that by grade 9 or 10, they can identify what they genuinely care about and start going deep. The activities students do in grades 11 and 12 work best when they are continuations of commitments that started earlier.
If my child has not decided on a major, what should they apply as?
This is more strategic than most families realize. For schools like UCLA where the major affects admission chances by 10 times or more, applying to a less competitive major (or to The College where major is not considered) can be the difference between admission and rejection. But this strategy only works if the student can credibly demonstrate interest in that major. Picking 'undeclared' or a lightly applied-to major just to game admissions usually does not work because the activity profile does not match. The right approach is to honestly identify where your child's interests sit, find majors that align with those interests at each target school, and check the actual major-level admit rates before finalizing the list.
Mapping a path through 2026's admissions reality
Oak Education helps families understand the changing US college admissions landscape and plan strategically across all four years of high school.
Start Free Assessment