
How the TMUA Is Scored
The TMUA gives a single overall score on a scale from 1.0 to 9.0, recorded to one decimal place. There is no pass mark, and there is no negative marking, so a wrong answer never costs you points.
Two things make the score hard to read on its own. First, it is scaled: your number reflects how the whole cohort performed that year, not a fixed percentage of correct answers. Second, you sit the test only once per cycle, and only that first score counts. So there is no official score you need. What matters is how your score compares with other applicants to the same course. For the basics of what the TMUA is, who requires it, and when to sit it, see our full TMUA and ESAT guide.
Where Your Score Places You
Because the scale is reset to the cohort each year, the most useful benchmark is the national distribution that UAT-UK, the test administrator, publishes. The scale is built so the middle of the cohort lands at a known point.
| TMUA score | Where it places you |
|---|---|
| 4.5 | The median: half of all candidates score below this |
| 6.0–6.5 | Well into the upper part of the cohort |
| 7.0 | The 90th percentile: only about 10% of candidates score higher |
| 9.0 | The capped maximum |
Source: UAT-UK, TMUA Test Results and Explanation of Results (October 2025): the scale fixes the median at 4.5 and the 90th percentile at 7.0, esat-tmua.ac.uk
There is also a clear regional pattern that matters for international families. UAT-UK's technical report shows applicants based outside the UK and EU scored higher on average (a mean of 4.74) than UK-based applicants (a mean of 3.86), and candidates identifying as Chinese, Singaporean, and from Hong Kong were among the higher-scoring groups. A strong score is very achievable from these regions, but it also means the bar among international applicants is high.
Source: UAT-UK, TMUA Technical Report 2024-25, mean scaled scores by region and nationality
What Imperial's Data Shows
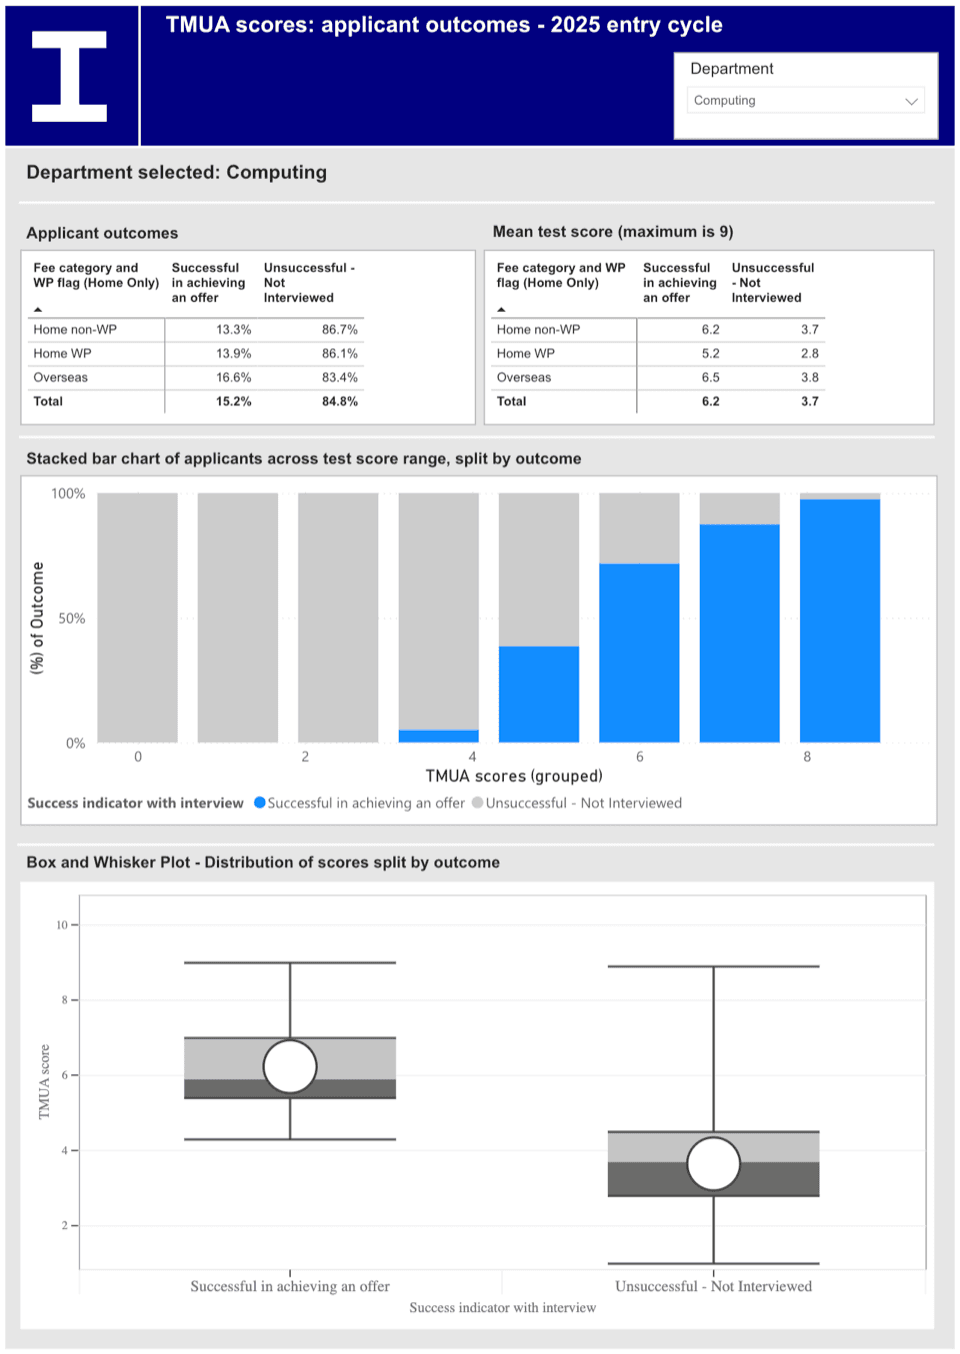
Imperial publishes an official dashboard of TMUA outcomes by department. For Computing in the 2025 cycle, the gap between successful and unsuccessful applicants is stark.
6.2
Computing offer-holders, average TMUA
3.7
Applicants not interviewed, average TMUA
6.5
Overseas offer-holders, average
5.2
Home WP offer-holders, average
Source: Imperial College London, Understanding your ESAT and TMUA scores, Computing department, 2025 entry, imperial.ac.uk
The shape of the chart is as telling as the averages. The probability of an offer rises steeply with the score: applicants in the lower bands were almost never interviewed, while the offer rate climbed to roughly 40% around a score of 5, about 70% around a 6, and close to 90% around a 7. These band figures are read from Imperial's chart, so treat them as approximate.
One label needs explaining. WP means widening participation. It flags UK applicants from backgrounds that are under-represented at university, for example those from lower-income families, the first in their family to attend university, or from areas and schools where few students go on to higher education. Imperial reads their TMUA score in the context of those circumstances, which is why WP offer-holders averaged 5.2, about a point below the 6.2 of other home offer-holders.
What Cambridge's Data Shows
Cambridge does not publish a dashboard, but it released Computer Science figures by college under a Freedom of Information request. Across the colleges, applicant scores averaged about 4.6 (close to the national median), while offer-holder scores averaged about 6.7 and ranged widely from college to college. The bottom row of the table shows these cross-college averages; the individual college rows show how much the picture varies.
| College | Applicant average | Offer-holder average |
|---|---|---|
| Christ's | 4.7 | 8.9 |
| Churchill | 4.5 | 6.3 |
| Clare | 4.5 | 6.0 |
| Corpus Christi | 4.7 | 6.9 |
| Downing | 4.2 | 6.7 |
| Emmanuel | 4.4 | 6.8 |
| Fitzwilliam | 4.7 | 6.5 |
| Girton | 4.1 | 6.1 |
| Gonville and Caius | 4.5 | 5.8 |
| Homerton | 4.7 | 5.9 |
| Hughes Hall | 7.0 | 6.7 |
| Jesus | 4.6 | 6.4 |
| King's | 4.3 | 5.8 |
| Lucy Cavendish | 4.6 | 6.7 |
| Magdalene | 4.3 | 5.6 |
| Murray Edwards | 4.5 | 6.2 |
| Newnham | 3.6 | 6.7 |
| Pembroke | 4.6 | 7.2 |
| Peterhouse | 4.2 | 6.8 |
| Queens' | 4.8 | 7.2 |
| Robinson | 5.1 | 8.3 |
| Selwyn | 4.5 | 7.6 |
| Sidney Sussex | 4.5 | 5.8 |
| St Catharine's | 4.4 | 6.4 |
| St Edmund's | 4.0 | N/A |
| St John's | 4.5 | 6.4 |
| Trinity | 5.0 | 7.7 |
| Trinity Hall | 4.2 | 7.0 |
| Wolfson | 4.6 | 6.2 |
| All colleges (average) | 4.6 | 6.7 |
Source: University of Cambridge, Freedom of Information response 2025/825, Computer Science (G400) average TMUA overall score by college, 2025 entry (released under FOI; not published on the university website). N/A indicates a figure suppressed for small numbers.
Two cautions when reading this table. Some colleges admit only a handful of Computer Science students, so a single average can swing on one or two people; Hughes Hall and Newnham are clear examples where small numbers distort the figure. And Cambridge pools strong applicants between colleges, so the college you apply to is not the whole story.
How to Read These Numbers
These figures are outcomes, not published cut-offs. Neither Imperial nor Cambridge sets a minimum TMUA score, and Cambridge stresses that the test measures mathematical thinking and is weighed alongside your predicted grades, interview, and the rest of your application. A high score strengthens your case; it does not by itself secure a place, and a single number below an average does not rule you out.
Read the data in bands, not thresholds. A score in the low 5s keeps you in contention at many colleges and departments; a 6 to 7 puts you in the comfortable range for competitive Computer Science; above 7 you are in the top tier nationally.
What This Data Does and Does Not Cover
A few honest limits. All the offer-holder data here is for Computer Science; other subjects use the TMUA too, but their offer-holder scores differ and are mostly unpublished. Imperial reports one department-wide figure while Cambridge reports per-college, so the two are not perfectly comparable, and Imperial's data is a published dashboard while Cambridge's came through a Freedom of Information request.
The picture is also incomplete across the G5. Oxford did not use the TMUA for 2025 entry at all, because it used the Mathematics Admissions Test (MAT) and only adopts the TMUA from 2027 entry. UCL and LSE require the TMUA for some courses but do not publish offer-holder scores. And because the scale is reset every year, all of these figures are historic and should be treated as a guide, not a target.
Turning a Target Into a Plan
With a realistic band in mind, the rest is preparation. The content sits at the level of strong A-level or equivalent mathematics, but the difficulty is in applying it quickly to unfamiliar, calculator-free, multiple-choice problems, so practising against the official specimen materials and question style matters more than learning new content.
For dates, format, fees, and the full list of universities that require the TMUA, see our TMUA and ESAT guide.
Preparing for the TMUA?
Oak runs an online summer intensive with separate 40-hour TMUA and ESAT tracks, taught by an NTU-NIE mathematics PhD, for applicants to the G5 and to Warwick and Durham.
Frequently Asked Questions
What is a good TMUA score?
There is no official pass mark. UAT-UK sets the median at 4.5 and the 90th percentile at 7.0, so anything from about 6.5 upwards is generally competitive, and 7.0+ puts you in roughly the top 10% of all test-takers.
Is there a minimum score to get an offer?
No published minimum. Imperial and Cambridge both treat the score as one factor among grades, interview, and personal statement, and Cambridge in particular publishes no cut-off. The figures in this article are what past offer-holders happened to score, not a threshold.
Why do Cambridge colleges show such different averages?
Partly real differences in how competitive each college's applicant pool was that year, and partly statistical noise, because some colleges admit only a handful of Computer Science students, which makes a single average jump around. Colleges also pool and reallocate strong applicants.
Do these scores apply to other subjects?
Not directly. The published offer-holder data here is for Computer Science. The scoring system and the national distribution apply to everyone, but offer-holder averages differ by subject and university, and most universities do not publish them.
Not sure what score to aim for?
Oak helps families read the data and build a realistic plan for UK G5 applications.
Start a free assessment